Observability
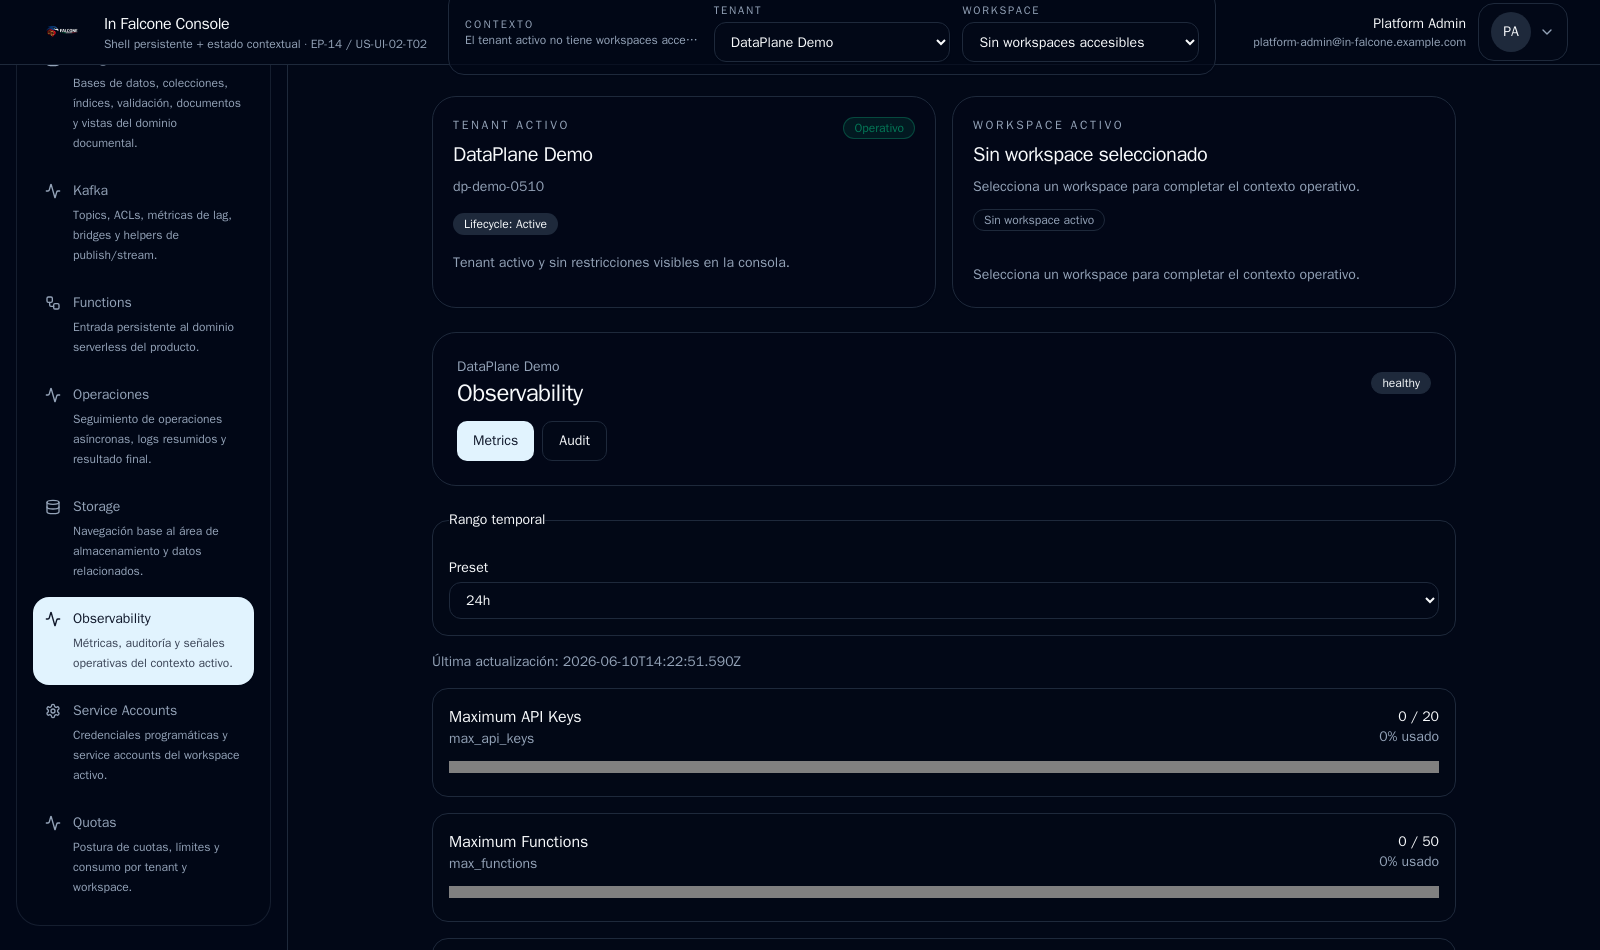
In Falcone ships a Prometheus-based observability stack (chart alias observability) and surfaces per-tenant signals in the console's Observability and Operations views.
What's collected
| Signal | Purpose |
|---|---|
| Platform metrics | Service health, request rates, latencies |
| Usage / consumption | Per-tenant resource usage (drives quotas & billing inputs) |
| Quota / limit signals | Threshold alerts, hard-limit enforcement decisions |
| Audit pipeline | Query-safe audit records for governed actions (e.g. function lifecycle) |
| Business metrics | Higher-level platform KPIs |
The repository enforces the schema and presence of these via npm run validate:observability-* checks (metrics stack, dashboards, health checks, business metrics, usage/consumption, quota policies, threshold alerts, hard-limit enforcement, console alerts, audit pipeline/event-schema/query/export/correlation surfaces).
Per-tenant visibility
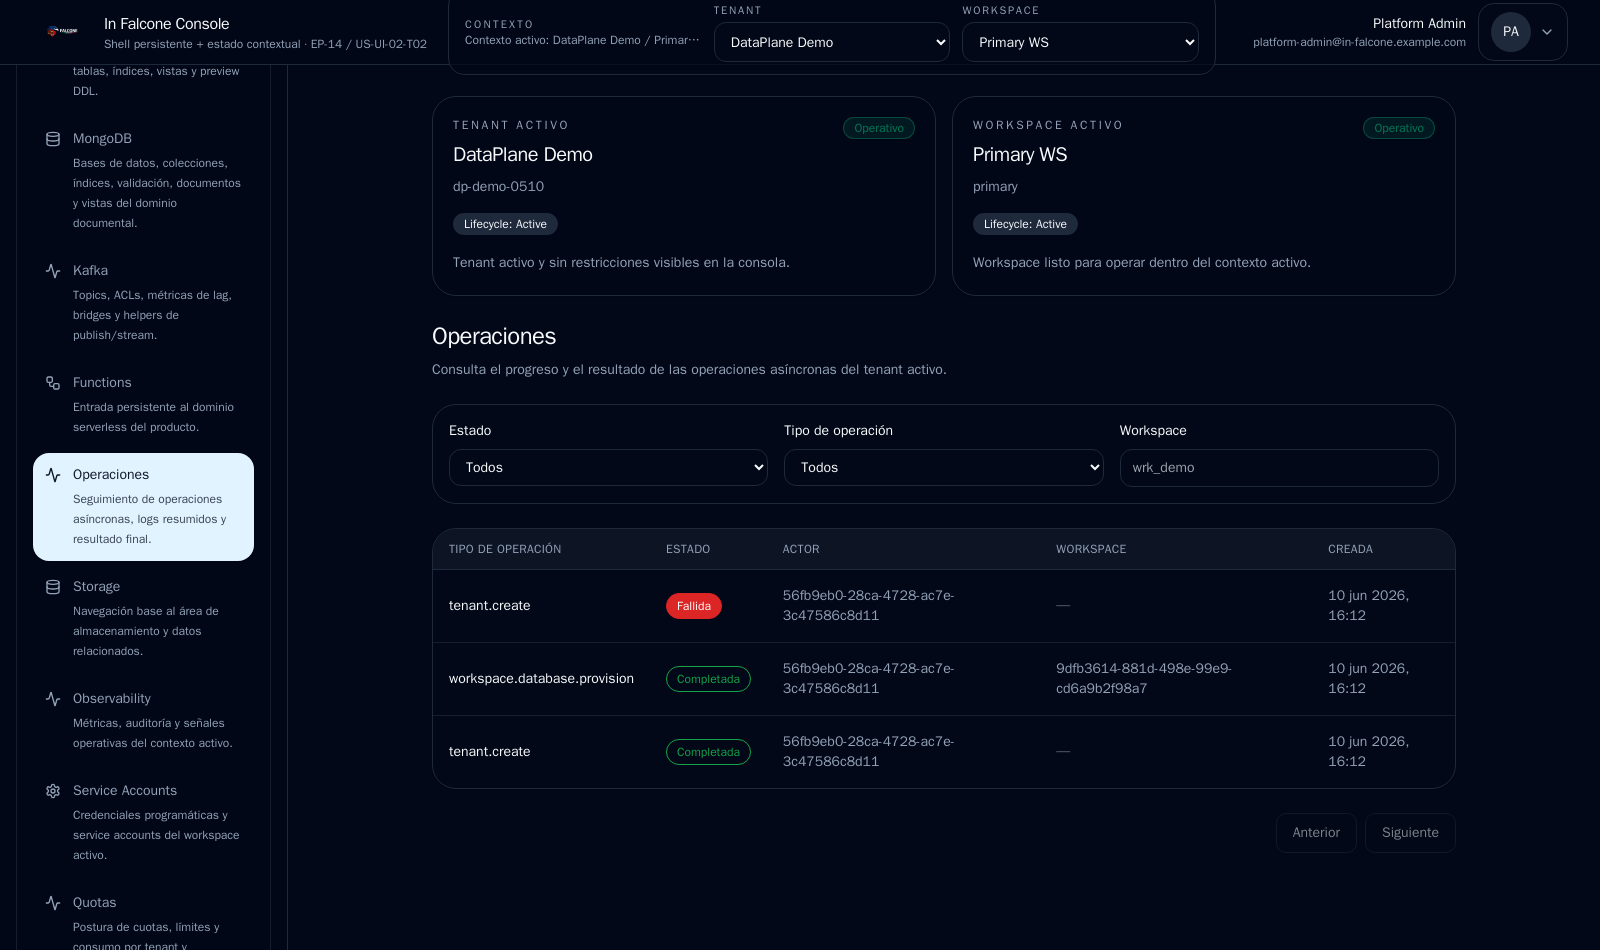
Metrics, usage and audit are tenant-keyed, so the console can show one tenant's consumption and operations without exposing another's. Operations records (with detail views) track governed actions and their outcomes.
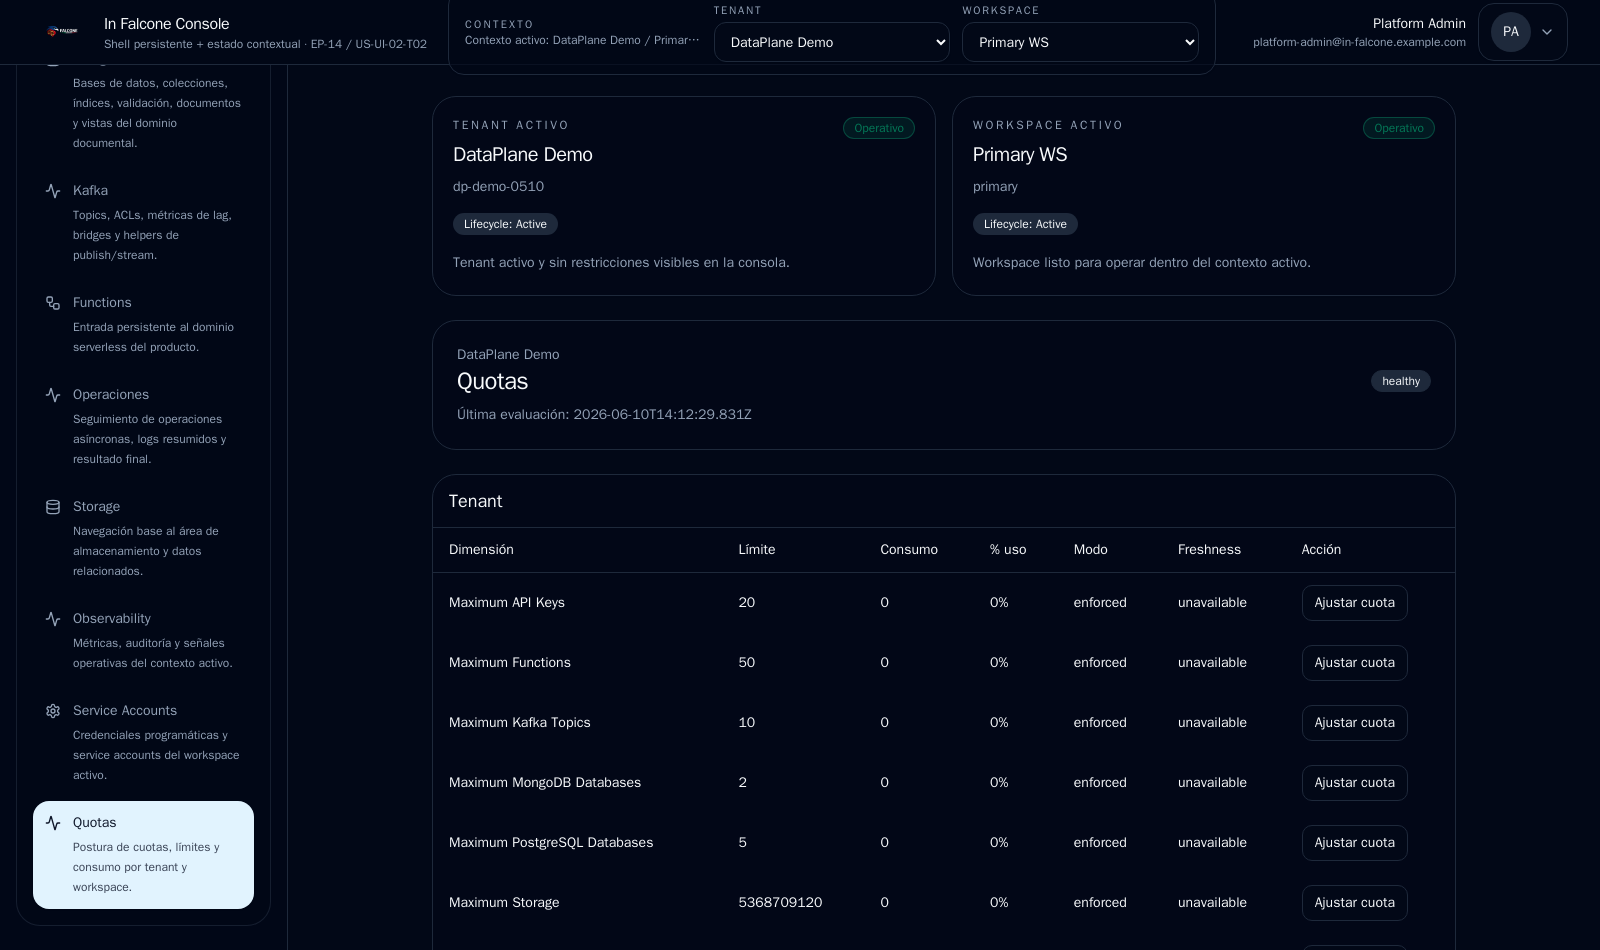
Quotas & hard limits
A plan's quota_policy defines enforced limits and overage behaviour (Domain Model). The observability stack raises threshold alerts as usage approaches a limit and records hard-limit enforcement decisions when a limit is hit — both visible in the console's Quotas view.
Health checks
Each component exposes health/readiness endpoints; helm upgrade --install gates on rollout completion. After install:
kubectl -n falcone rollout status deploy --timeout=300s
kubectl -n falcone get pods
Audit
Governed operations (function deployments, admin actions, rollbacks, quota enforcement) produce query-safe audit records (domain-model.json), retained for compliance and surfaced through the audit query/export/correlation surfaces.
Flows & MCP signals (Preview)
The AI-native capabilities are first-class in the same stack:
- Flows — Temporal execution health plus the flow lifecycle audit topic (
FLOW_AUDIT_TOPIC); per-tenant flow quotas are enforced through the same quota machinery. - MCP —
mcpis a first-class audit subsystem (per-OAuth-client governance events), tenant-scoped and queryable in the console; per-tool-call usage rides thein_falcone_mcp_tool_invocations_totalmetric (business domainmcp_tool_usage) with latency on the normalized component-latency family, and themcp_tool_invocationsquota dimension surfaces in the per-tenant quota posture. All of these are covered by thevalidate:observability-*checks above. See MCP Architecture.